Every number, in one place.
The Analytics & Reports module is the platform’s unified measurement layer. Stop exporting CSVs from five different tools. Get a clear, real-time view of campaign performance, subscriber trends, and automation effectiveness—natively.
Scattered data is blind data.
If your reporting lives in five different tabs, you’re not measuring performance—you’re guessing at it. Clear decisions require a single source of truth.
Total visibility, structured.
A centralized reporting hub spanning campaigns, subscribers, automation, webhooks, and push. Every metric you need, compiled natively.
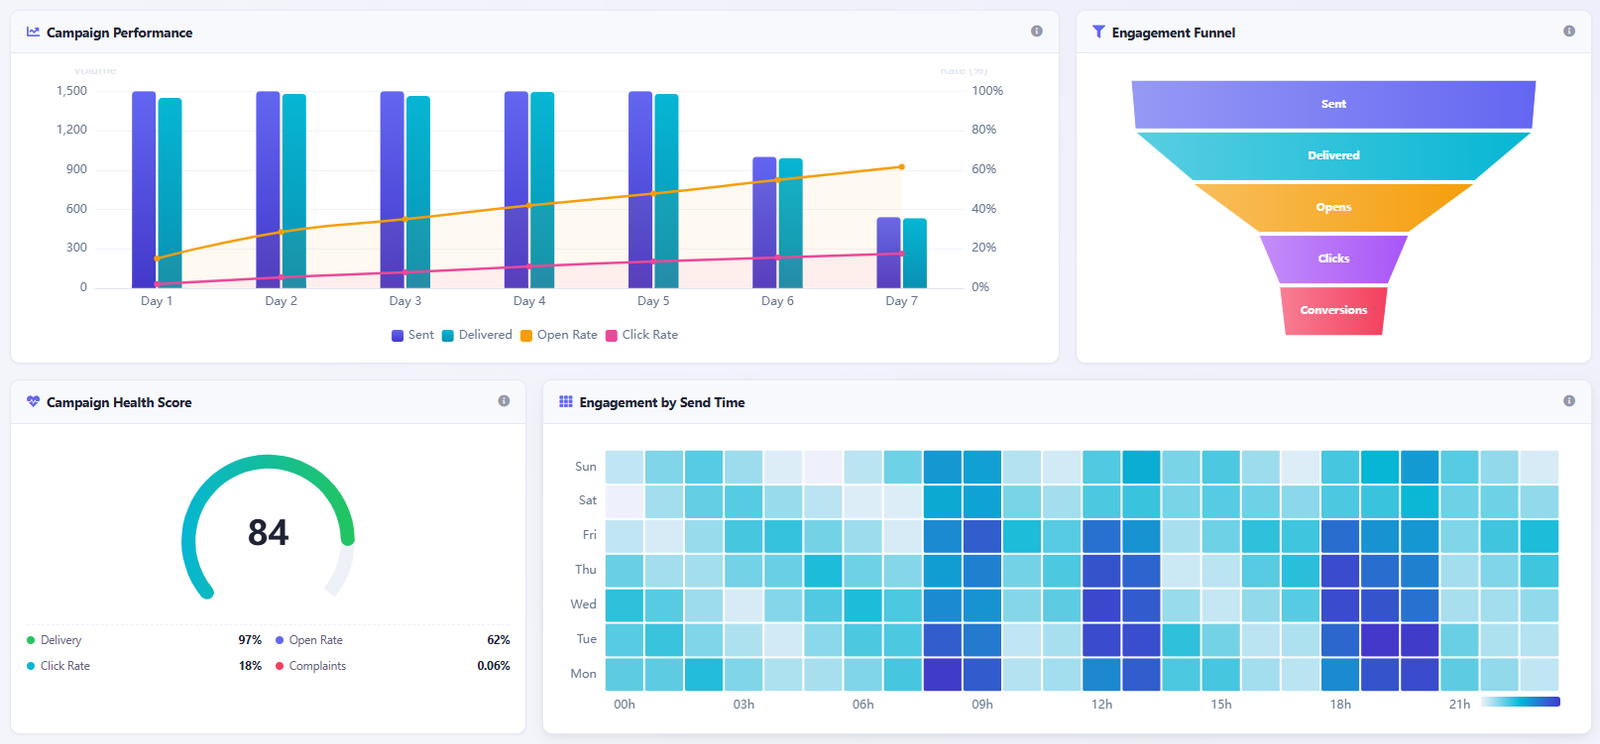
Campaign Performance
Track sends, opens, clicks, and conversions across standard, recurring, and sequence campaigns in one unified view.
Subscriber Trends
Monitor list growth, churn, and engagement over time.
Email Activity Log
Provider-side truth on every sent, delivered, or bounced email.
Webhook & Automation Reporting
Monitor trigger fire rates, workflow drop-offs, and webhook delivery success rates. Know exactly where your automation engine needs tuning.
Five dimensions of truth.
Four views. Total clarity.
DRAG OR USE ARROWS TO NAVIGATE
Measure what matters.
From event to insight.
Auto-Collected
Data is captured natively as campaigns send and subscribers interact.
Organized
Metrics are sorted by module—campaigns, lists, webhooks, automation.
Visualized
Transformed into clear, readable charts and status indicators.
Actionable
Exportable reports ready for stakeholder review and optimization.
Top-level stats, deeply broken down.
Don’t just look at a flat 42% open rate. Break it down by specific campaign, by audience segment, and by time period to understand exactly what drives engagement.
See which links inside your emails actually drove traffic. Track click performance per subscriber, per segment, and per smart link tag.
Track entry volume, step drop-off rates, and final conversion metrics for every active workflow. Optimize the exact bottleneck in your sequence.
Built for every review.
Weekly Performance Review
Generate a comprehensive overview of sends, opens, and clicks for the week. Perfect for Monday morning team syncs and stakeholder updates.
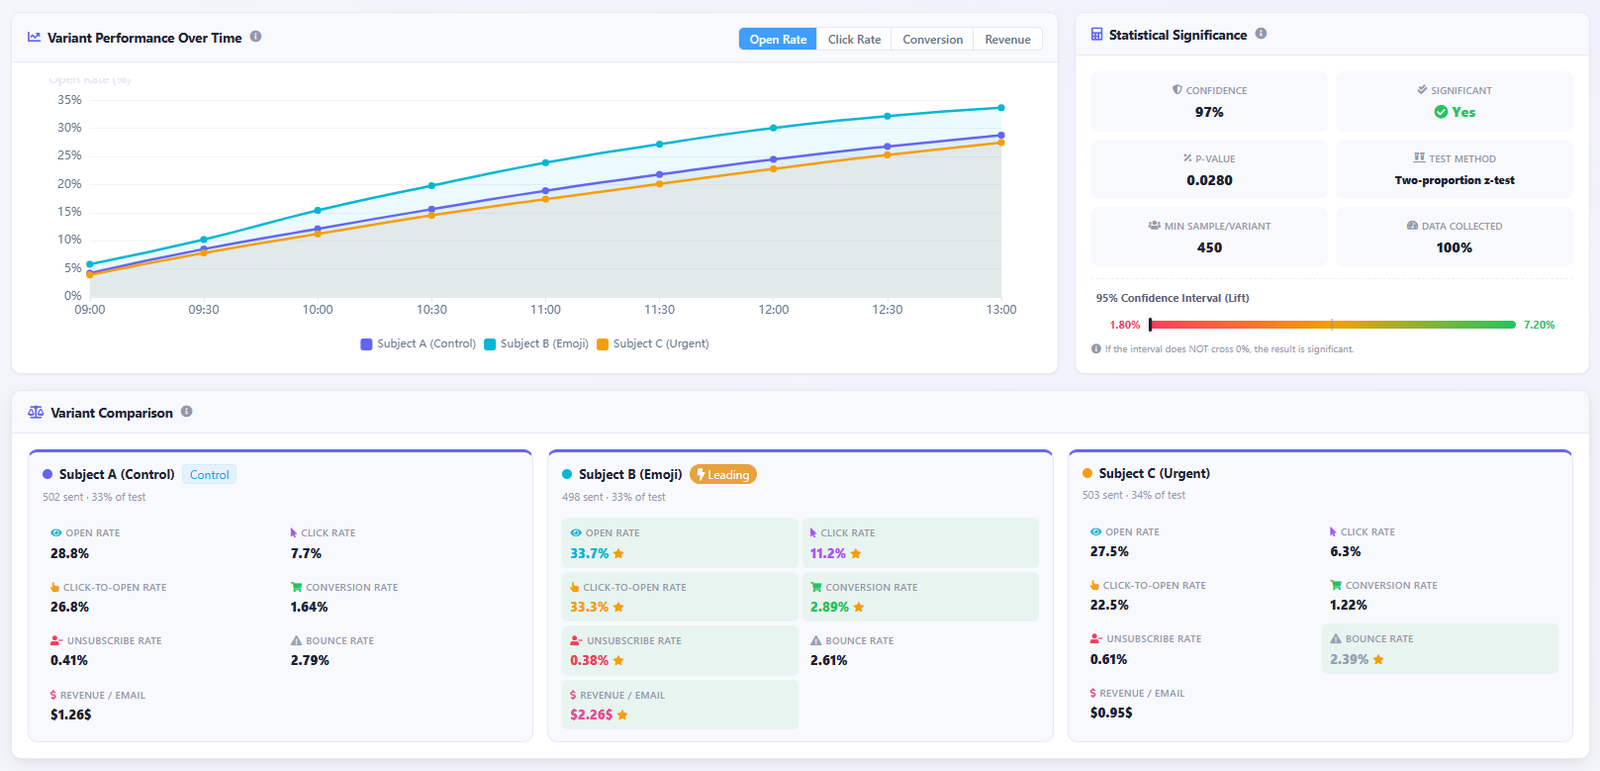
Campaign A/B Comparison
Place two campaigns side-by-side to compare subject lines, content, and send times. Know definitively what outperformed what.
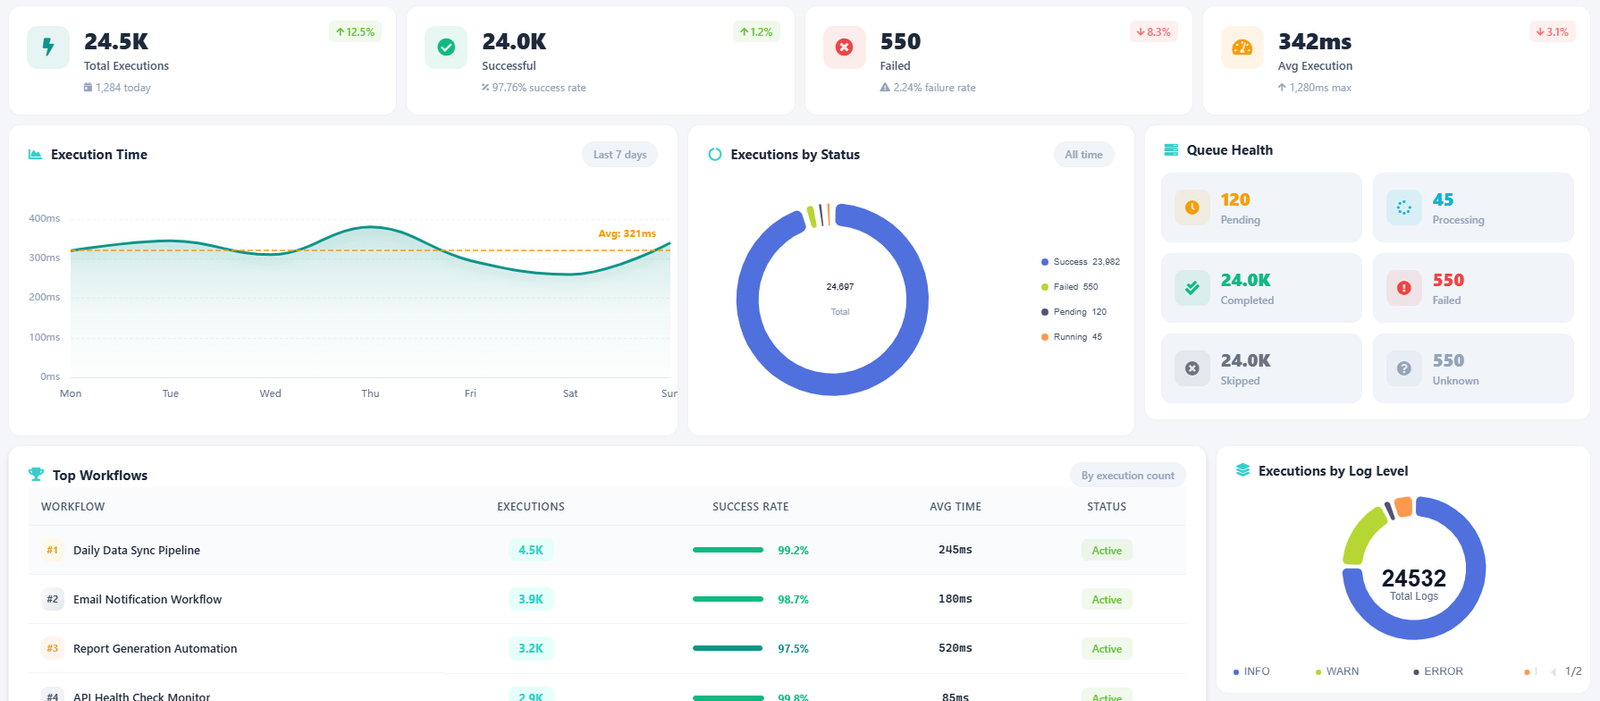
Automation Effectiveness Check
Audit your active workflows. See which sequences are driving conversions and which steps are causing subscribers to drop off.
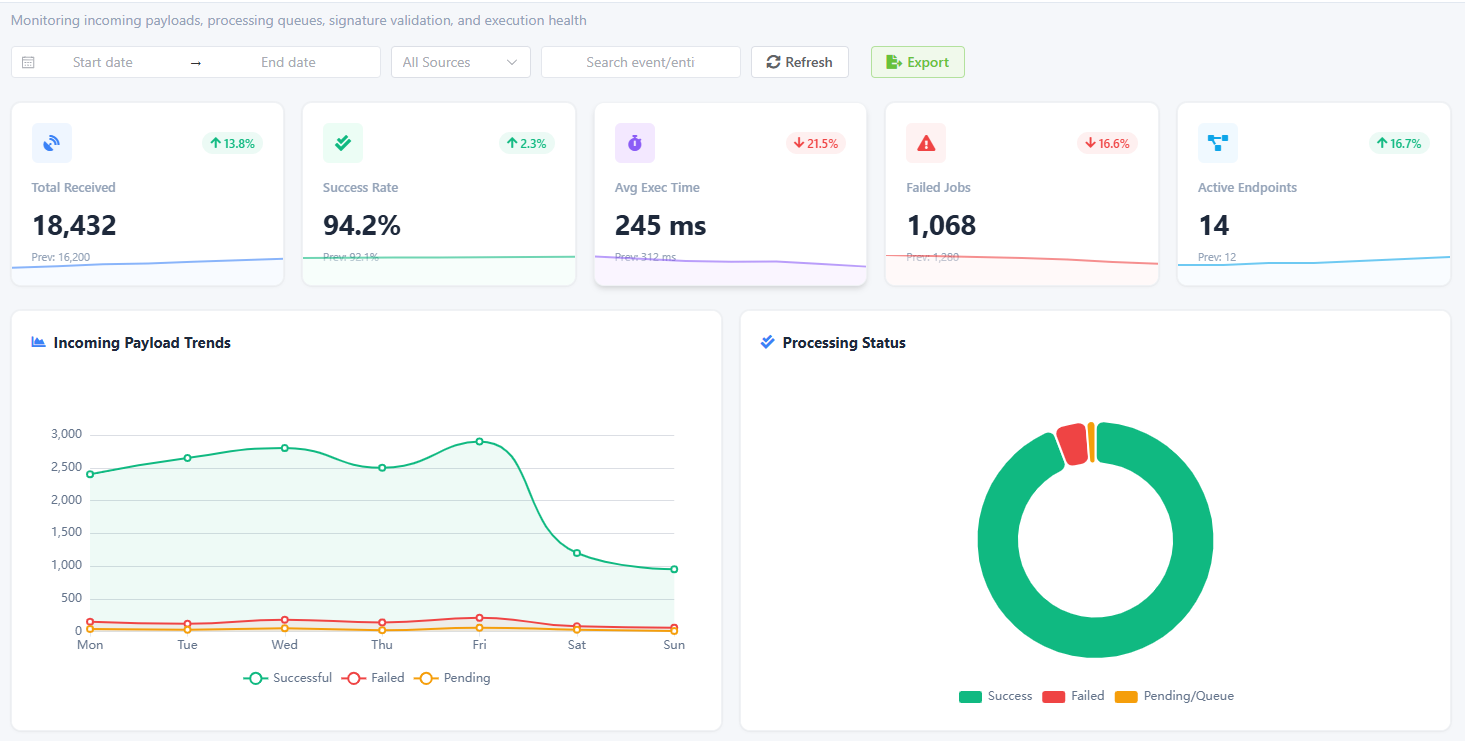
Webhook Activity Audit
Monitor incoming and outgoing webhook success rates. Catch integration failures before they silently break your automated data flows.
Data that moves.
Don’t keep your insights trapped in the dashboard. Export, share, and integrate your analytics data natively.
One-Click CSV
Export any report view to CSV instantly for offline analysis, presentation prep, or stakeholder sharing.
Shareable Links
Generate secure, non-admin links to specific dashboard views for your team or external clients.
Webhook Push
Push analytics events out to external data warehouses or BI tools via the Webhooks module.
Decisions backed by data.
Stop guessing. Start measuring. When every metric lives in one place, your marketing strategy becomes a precision instrument.
One engine. Flexible licensing.
- ✓1 Site License included
- ✓1 year of updates and support
- ✓All features included
- ✓Priority support access
- ✓Free access to future module updates
- ✓5 Site Licenses included
- ✓1 year of updates and support
- ✓All features included
- ✓Priority support access
- ✓Free access to future module updates
- ✓15 Site Licenses included
- ✓1 year of updates and support
- ✓All features included
- ✓Priority support access
- ✓Free access to future module updates
- ✓50 Site Licenses included
- ✓1 year of updates and support
- ✓All features included
- ✓Priority support access
- ✓Free access to future module updates